
Uncategorized
How to Create Stunning Project Status Reports in Confluence
Struggling to keep everyone updated on the project status? We’ll show you how to easily

Managing a project is one thing. Delivering a status report that clearly communicates progress to stakeholders at a glance? That’s a completely different challenge. Too often, project status reports turn into walls of text or messy tables that confuse more than they clarify.
But it doesn’t have to be this way. In this article, you’ll learn how to: turn your project updates into visually engaging and easy-to-understand reports using Confluence.
By the end, you’ll have all the tools you need to elevate your reports from functional to unforgettable.
A project status report is a snapshot of your project’s progress, designed to keep stakeholders informed and aligned. It answers the critical questions: Where are we now? What have we accomplished? What’s coming next?
At its core, a great project status report provides a high-level look of where we are in the project phase, making it easier for stakeholders to track progress, identify risks, and understand key milestones.
Set Clear Expectations in the Planning Phase
At the start of your project, status reports help define the scope, establish a baseline, and align everyone on timelines and deliverables. They ensure all stakeholders share the same vision from the very beginning.
Track Progress and Ensure Alignment Mid-Project
As your project progresses, status reports become essential for monitoring key milestones and tracking progress. They act as a central point of truth, keeping stakeholders informed and team members aligned on goals and timelines.
Provide Clarity as You Approach the Finish Line
Nearing completion, status reports highlight what’s been accomplished, what’s left to do, and any potential risks to meeting the final deadlines. They also celebrate progress, boosting morale as the team pushes through the final phase.
Foster Transparency and Build Trust
Regular updates show accountability and ensure everyone—from team members to executives—feels confident in the project’s direction.
Help Identify and Address Risks Early
Status reports provide a platform to flag potential blockers before they escalate. With risks communicated clearly, stakeholders can collaborate on solutions and keep the project on track.

Not all projects are the same, and neither are the reports you need to keep them on track. Let’s explore some of the most common types of project status reports and how they serve different needs.
A monthly report (or weekly or quarterly, depending on the pace of your project) is a regular update that provides stakeholders with a snapshot of progress over a specific time period. These reports are ideal for tracking project progress, celebrating small wins, and identifying risks early.
Milestone reports focus on key moments in your project. Whether you’ve finished a big deliverable or started a new phase, these reports celebrate progress and set expectations for what’s next. They’re great for project updates when reaching major goals.
Designed for leadership, executive reports stick to the big picture. They focus on overall status, key risks, and important milestones. These reports are simple, clear, and easy to scan—ideal for giving stakeholders a quick understanding of the project.
Every project faces challenges. These reports identify risks, explain their impact, and suggest solutions. They help teams stay proactive and keep the project moving forward.
Once the project wraps up, a final report provides a comprehensive review of its lifecycle. It includes key outcomes, lessons learned, and overall performance against initial goals. This type of project report serves as a historical record and a tool for continuous improvement in future projects.
A great project status report isn’t just about sharing updates—it’s about making those updates meaningful and easy to understand. Here’s what a great status report should include:
Start with a brief summary of the project’s current state. This should answer:
What is the overall status? (e.g., “On Track,” “Delayed,” or “At Risk.”)
What’s the goal of the project?
Highlight major achievements and upcoming goals.
Example: “Milestone 1: Completed user testing on January 15th. Next: Launch beta on February 1st.”
Transparency is key when it comes to risks. Identify potential blockers, their impact, and the steps you’re taking to address them.
Example: “Risk: Supplier delays may affect the timeline. Mitigation: Engaged an alternate supplier to reduce impact.”
Show measurable progress with visuals like progress bars, percentages, or charts. For example:
“80% of tasks completed in Sprint 5.”
“Budget used: 70%, with 30% remaining for final phase.”
This section provides the bigger picture. Share insights, patterns, or trends that might not be immediately obvious. For example:
“Customer feedback has been overwhelmingly positive, highlighting ease of use as a major strength.”
“While on track, the team’s pace has slowed in the current phase due to external dependencies.”
This helps stakeholders understand not just what’s happening, but why it matters.
End with clear, actionable steps.
Example: “Finalize design mockups by February 10th. Begin user feedback surveys by February 15th.”

The key to creating an insightful project status report is gathering the right data, organizing it clearly, and ensuring it answers the big questions: Where are we now? What’s next?
If you’re managing your projects in Jira, you already have a goldmine of data at your fingertips. Jira issues, epics, and sprints hold the details you need to create a report that’s both comprehensive and up-to-date. But pulling it all together manually can be time-consuming and error-prone.
That’s where Report Builder comes in. It’s the perfect tool for creating custom reports directly from Jira. With Report Builder, you can, automate the process of gathering data from Jira issues. Using real-time data, Report Builder keeps your reports accurate without the extra effort. Please read the article How to Create a How to Create a Project Status Report in Jira from our friends at Actonic if you want to know how to visualize Jira data for the perfect status report.
Collecting the right data is half the battle, but how you present it makes all the difference. A cluttered table or a plain text report won’t grab your stakeholders’ attention. To truly showcase your project’s progress, you need a platform that lets you organize and visualize your report beautifully. Confluence is perfect to achieve that!
Confluence offers a built-in project status report template to help you get started.
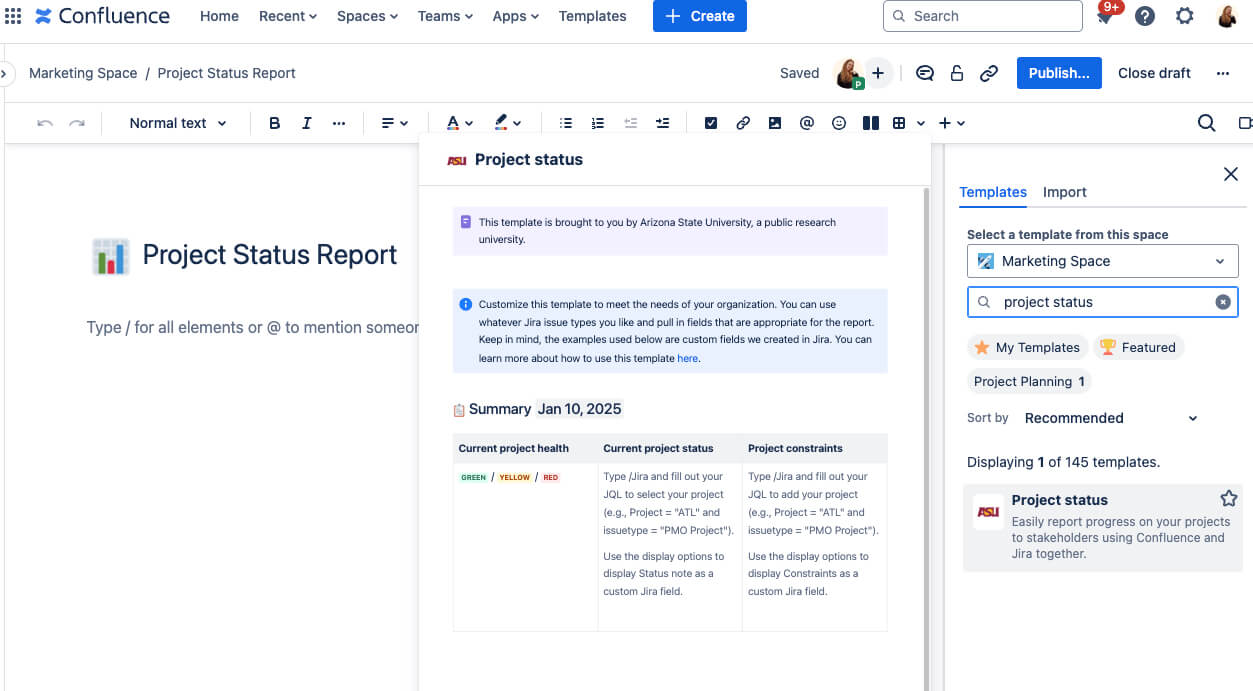
It’s simple to use and provides a structured way to summarize your data, include milestones, and outline next steps. For many teams, this template is a great first step toward creating a clean and professional report.
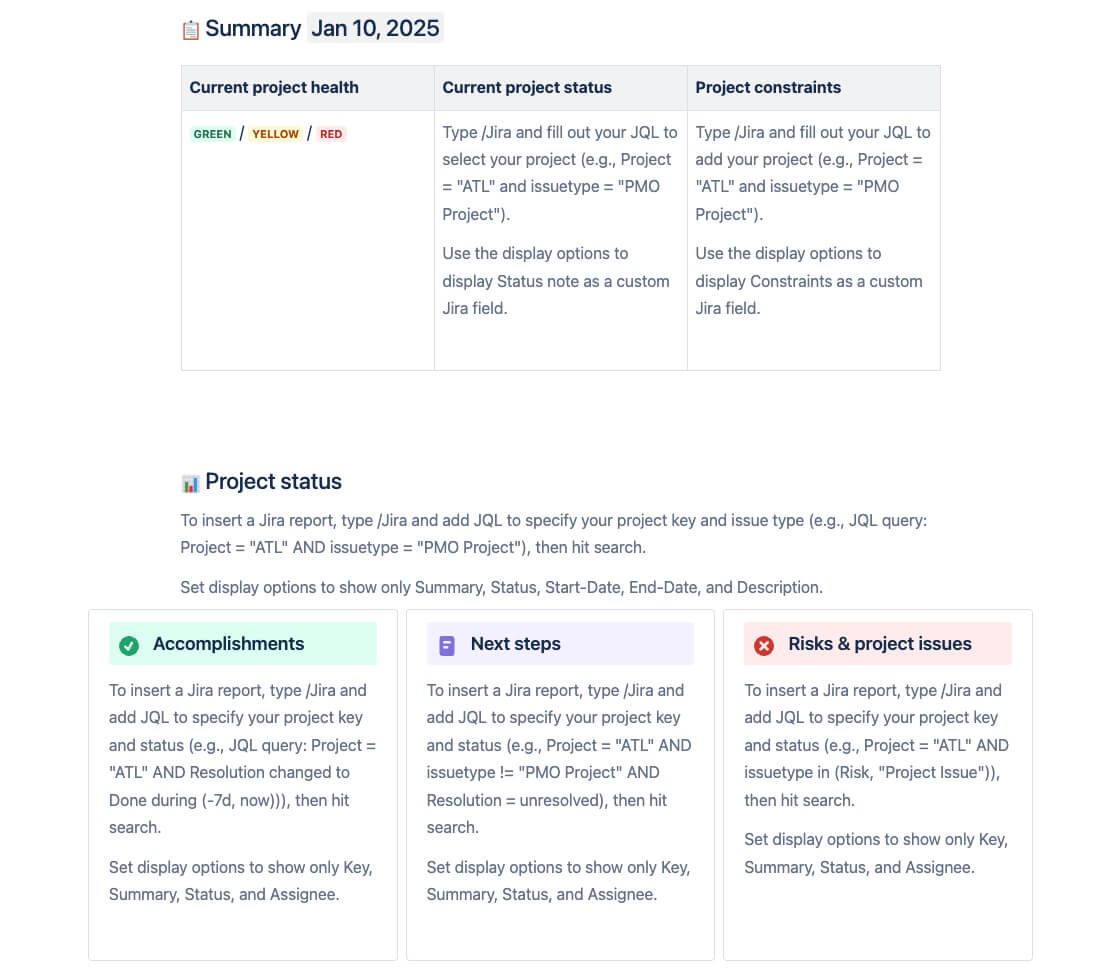
While this project status report template is functional, it doesn’t exactly wow your stakeholders. Its basic formatting and simple layout can feel static and uninspired. If you want your report to do more than just inform—if you want it to engage and impress—then you need tools that can bring it to life.
Fortunately, the Atlassian Marketplace is full of powerful page-building and design tools that can transform your Confluence pages. One of these tools is Karma, a free and intuitive macro that makes it easy to create stunning layouts and even templates for your project status reports.
Karma is a drag-and-drop page builder designed to help you create dynamic, professional-looking Confluence pages without any design skills. It offers pre-designed templates and customizable elements, so you can structure your report exactly the way you need it. With Karma, you can:
Build interactive layouts for clear, easy-to-read reports.
Use components like images, cards, buttons, counters, or stepers to visualize project phases.
Start quickly with ready-made templates for status reports, updates, and more.
Now, let’s dive into a step-by-step guide on how to use Karma to build the foundation of your report.
Create a New Page:
In Confluence, click the Create button to start a blank page.
Give your page a title, like “Project Status Report – [Project Name].”
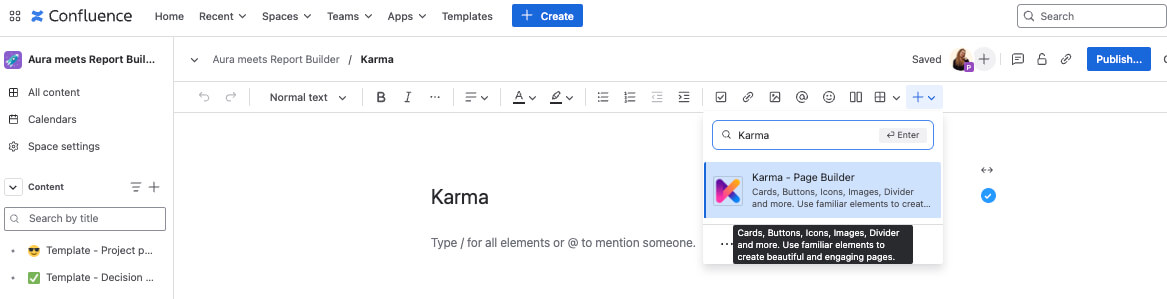
Insert the Karma Macro:
Click the Insert More Content (+) button in the Confluence editor toolbar.
From the dropdown, search for and select Karma.
Karma offers a variety of pre-designed templates tailored for different types of reports.
Select a template that fits your project’s needs—whether it’s focused on progress tracking, risks, or key milestones.
4. Modify the Layout:
Use Karma’s drag-and-drop editor to rearrange sections or add new ones.
Add placeholders for content like milestones, risks, and upcoming tasks.
Adjust the template to reflect your project’s unique details.
Once you’ve built the foundation of your project status report with Karma, it’s time to take it to the next level with Aura Content Formatting. Aura is packed with interactive and visually stunning macros that make your Confluence page more engaging and easier to understand. This macro suite perfect for highlighting key details, breaking up content into digestible sections, and making your report shine.
Use Status Macros: Interactive status indicators that give stakeholders an instant understanding of the project’s current state (e.g., “On Track,” “At Risk,” or “Delayed”). Aura allows you to fully customize the design—choose colors, icons, and even add explanatory text for context. Plus, you can dynamically work on them and update the status even in view mode.
Add Progress Bars: Visualize how far along your project is in a single glance. Progress bars make it easy to communicate the percentage of tasks completed, timelines reached, or milestones achieved.
Create Aura Cards: Group related information into clickable, stylish cards for a clean, organized layout. Aura Cards help avoid information overload, guiding readers to focus on what matters most.
And they can look like this in your project status report:
Embed Content Seamlessly: Integrate live data from Jira reports (e.g., using Report Builder) directly into your Confluence page. Embed detailed progress reports, sprint summaries, or issue tracking tables.
A final project status report page could look like this:
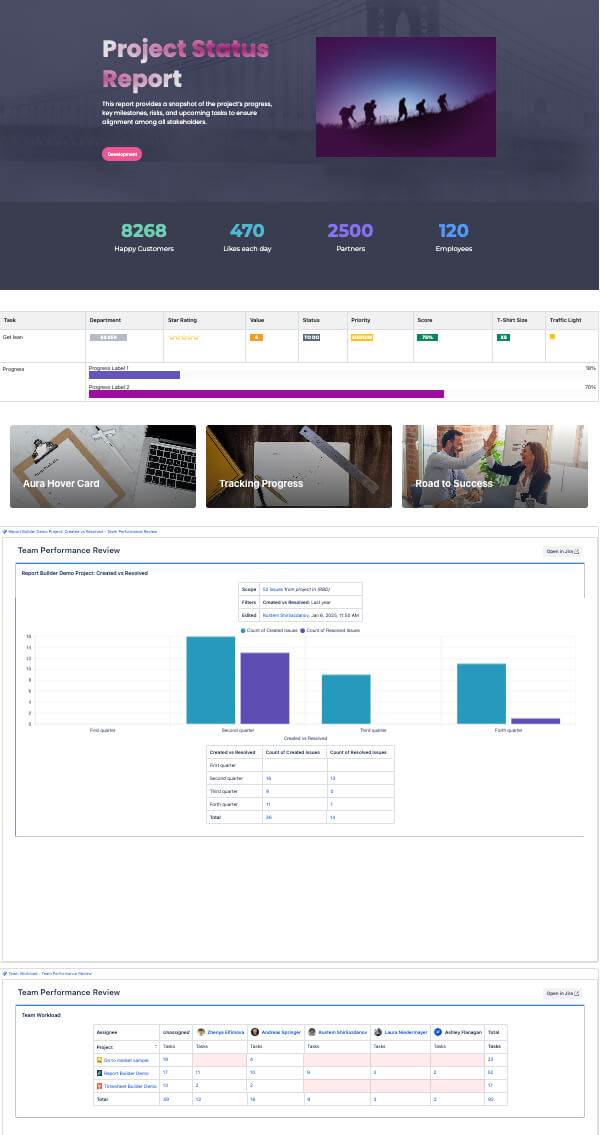
Creating the best project status update is all about balance. Data alone won’t win, you also need to present it in a way that informs, engages, and drives action. By combining live, up-to-date insights from Jira with tools like Report Builder, combined with the powerful visuals offered by Aura and Karma, you can create a report that checks all the boxes.
This winning combination ensures your stakeholders get the clarity they need while leaving a lasting impression with professional, polished design.
Start mixing live data with great visuals today, and watch your reports transform from functional to unforgettable. Get Karma now or try Aura for free.
Want more insights? Schedule a free demo of both tools and see the magic in action!
Supercharge your Confluence
Struggling to keep everyone updated on the project status? We’ll show you how to easily

Tired of endlessly scrolling through Confluence to find what you need? We’ll show you how

The right intranet can make the difference if you thrive your simply survive. We’ll show

You are currently viewing a placeholder content from Wistia. To access the actual content, click the button below. Please note that doing so will share data with third-party providers.
More Information